The following shows some simple examples of patch processing. See the proc module documentation for a list of processing functions.
Basic
There are several “basic” processing functions which manipulate the patch metadata, shape, etc. Many of these are covered in the patch tutorial, but here are a few that aren’t:
Transpose
The transpose patch function patch function simply transposes the dimensions of the patch, either by rotating the dimensions or to a new specified dimension.
import dascore as dcpatch = dc.get_example_patch()print(f"dims before transpose: {patch.dims}")transposed = patch.transpose()print(f"dims after transpose: {transposed.dims}")# dims can be manually specified as welltransposed = patch.transpose("time", "distance")
dims before transpose: ('distance', 'time')
dims after transpose: ('time', 'distance')
Squeeze
The squeeze patch function removes dimensions which have a single value (just like numpy.squeeze).
import dascore as dcpatch = dc.get_example_patch()# select first distance value to make distance dim flat.flat_patch = patch.select(distance=0, samples=True)print(f"Pre-squeeze dims: {flat_patch.shape}")squeezed = flat_patch.squeeze()print(f"Post-squeeze dims: {squeezed.shape}")
import numpy as npimport dascore as dcpatch = dc.get_example_patch()# create a patch with nan valuesdata = np.array(patch.data)data[:, 0] = np.NaNpatch_with_nan = patch.new(data=data)# drop Nan along axis 1dim = patch_with_nan.dims[1]no_na_patch = patch_with_nan.dropna(dim)assertnot np.any(np.isnan(no_na_patch.data))
Decimate
The decimate patch function decimates a Patch along a given axis while by default performing low-pass filtering to avoid aliasing.
Data creation
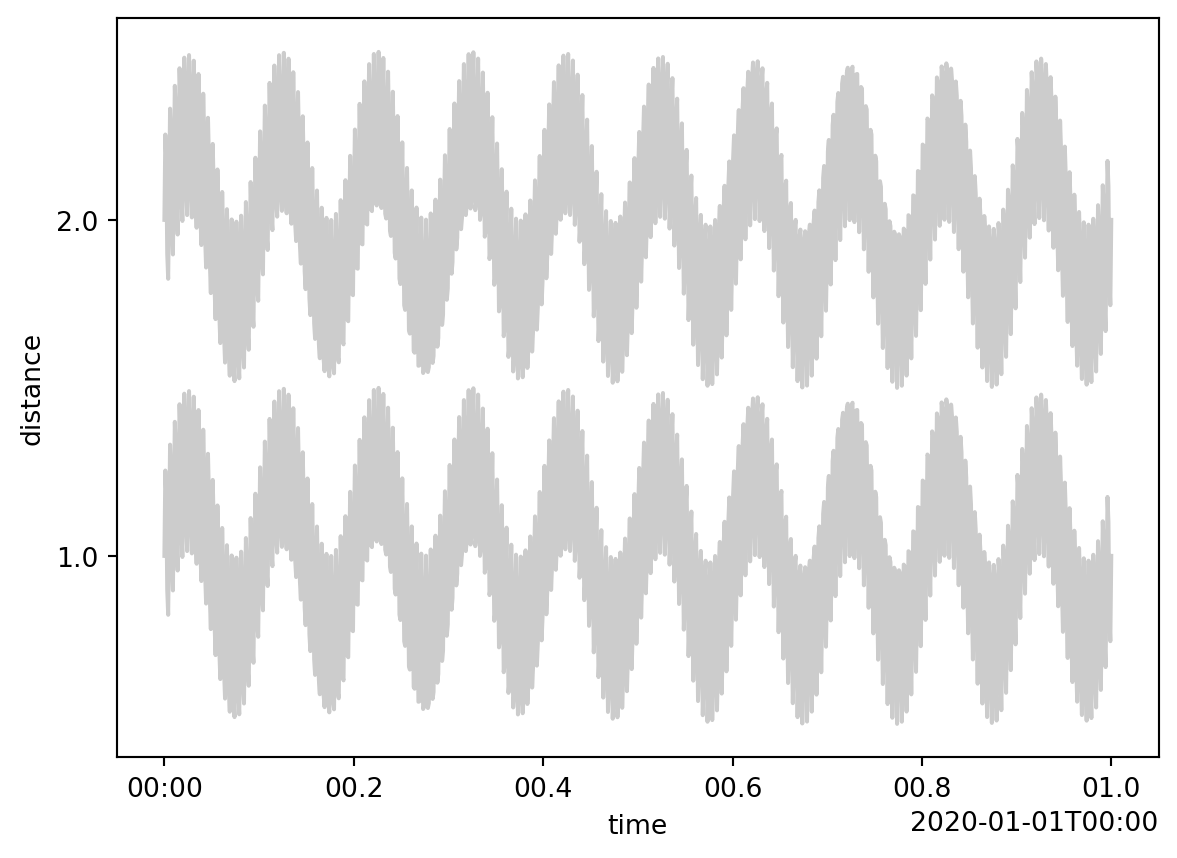
First, we create a patch composed of two sine waves; one above the new decimation frequency and one below.
import dascore as dcpatch = dc.examples.get_example_patch("sin_wav", sample_rate=1000, frequency=[200, 10], channel_count=2,)patch.viz.wiggle(show=True);
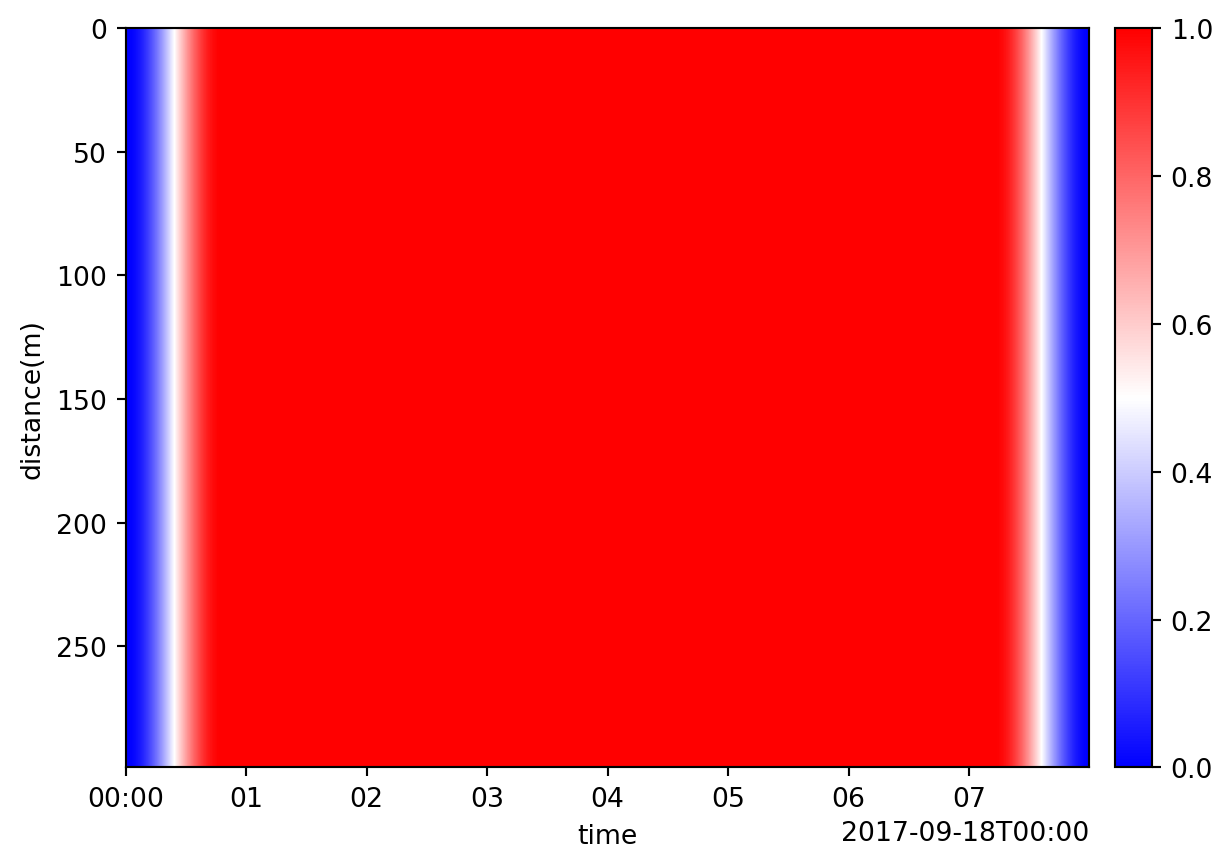
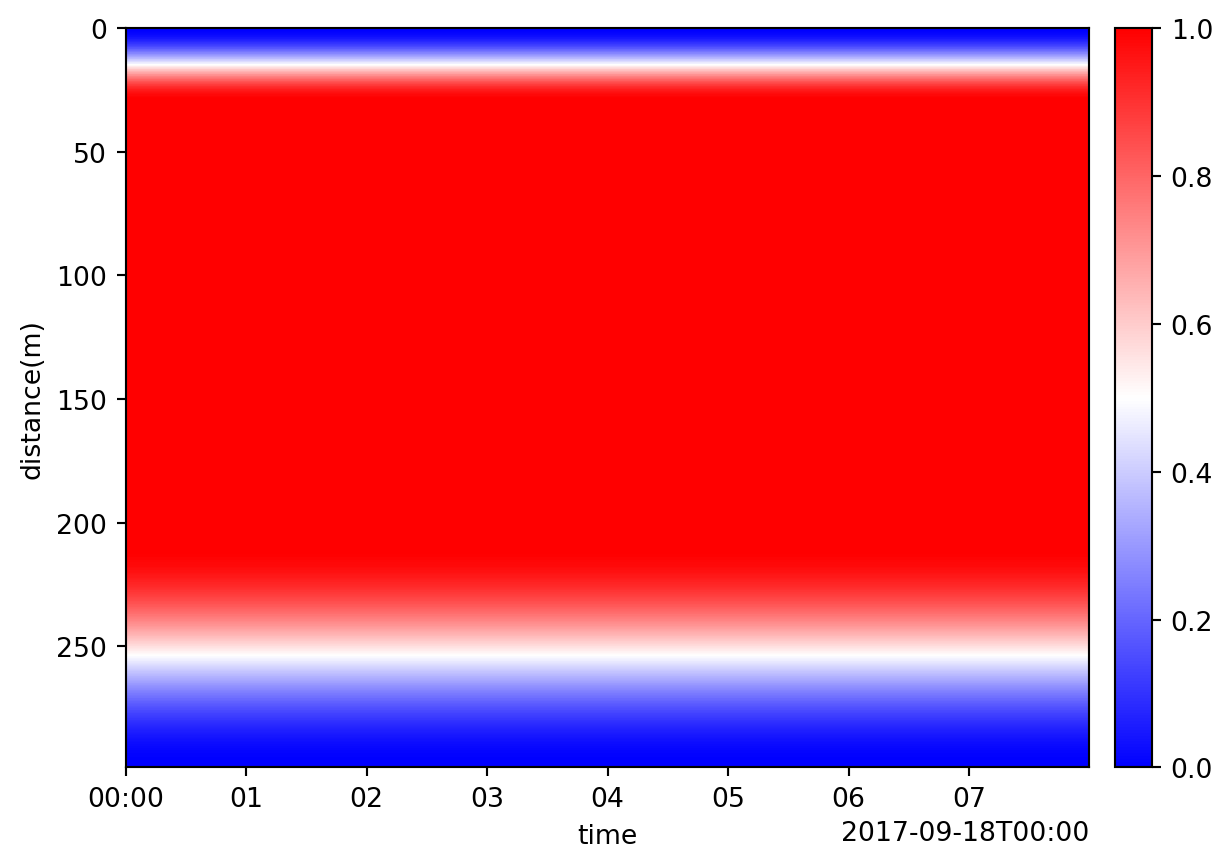
The taper function is used to gently taper the edges of a patch dimension to zero. To see this, let’s create a patch of all 1s and apply the taper function
import numpy as npimport dascore as dc_patch = dc.get_example_patch()patch_ones = _patch.new(data=np.ones_like(_patch.data))
The following code will apply a 10% taper, meaning the first and last 10% of the samples, along the time dimension.
patch_ones.taper(time=0.1).viz.waterfall();
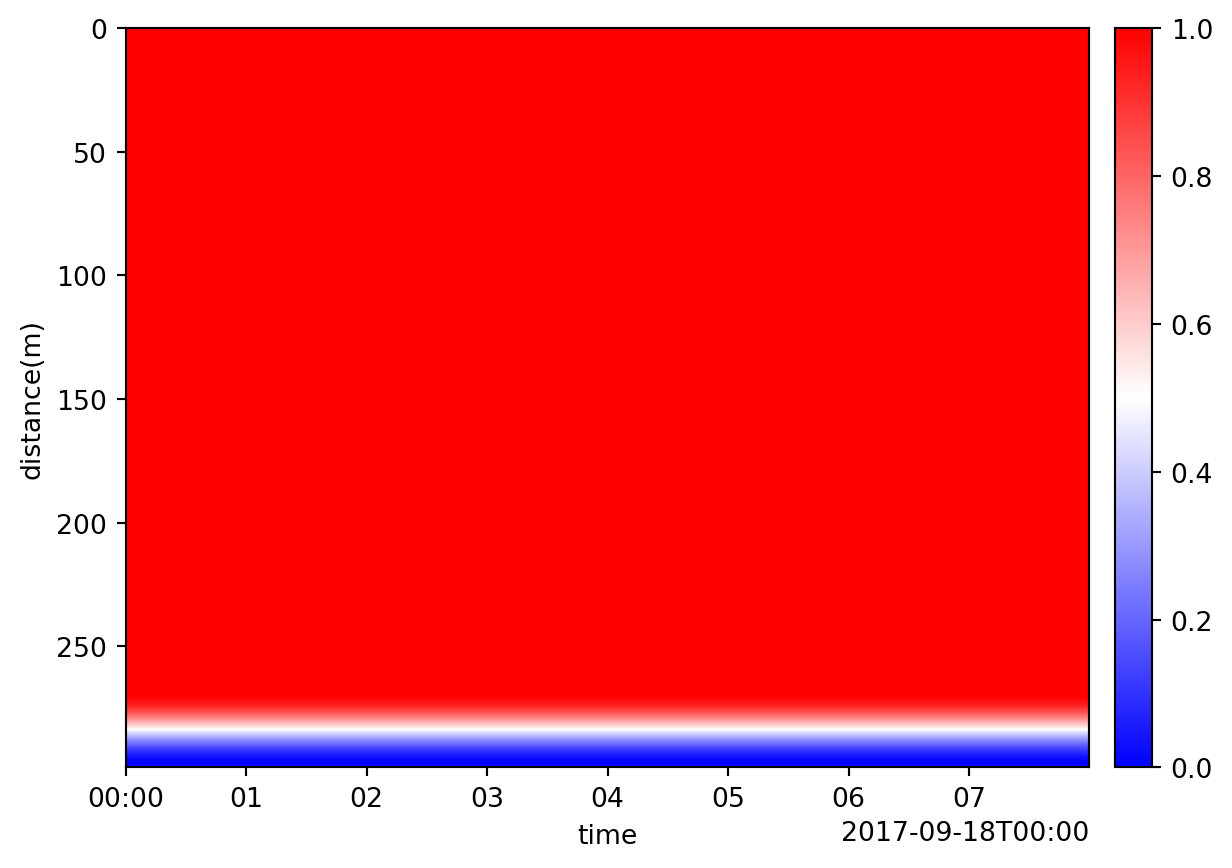
Of course, any dimensions works, and passing a tuple of values enables different amounts of tapering for each end of the dimension.
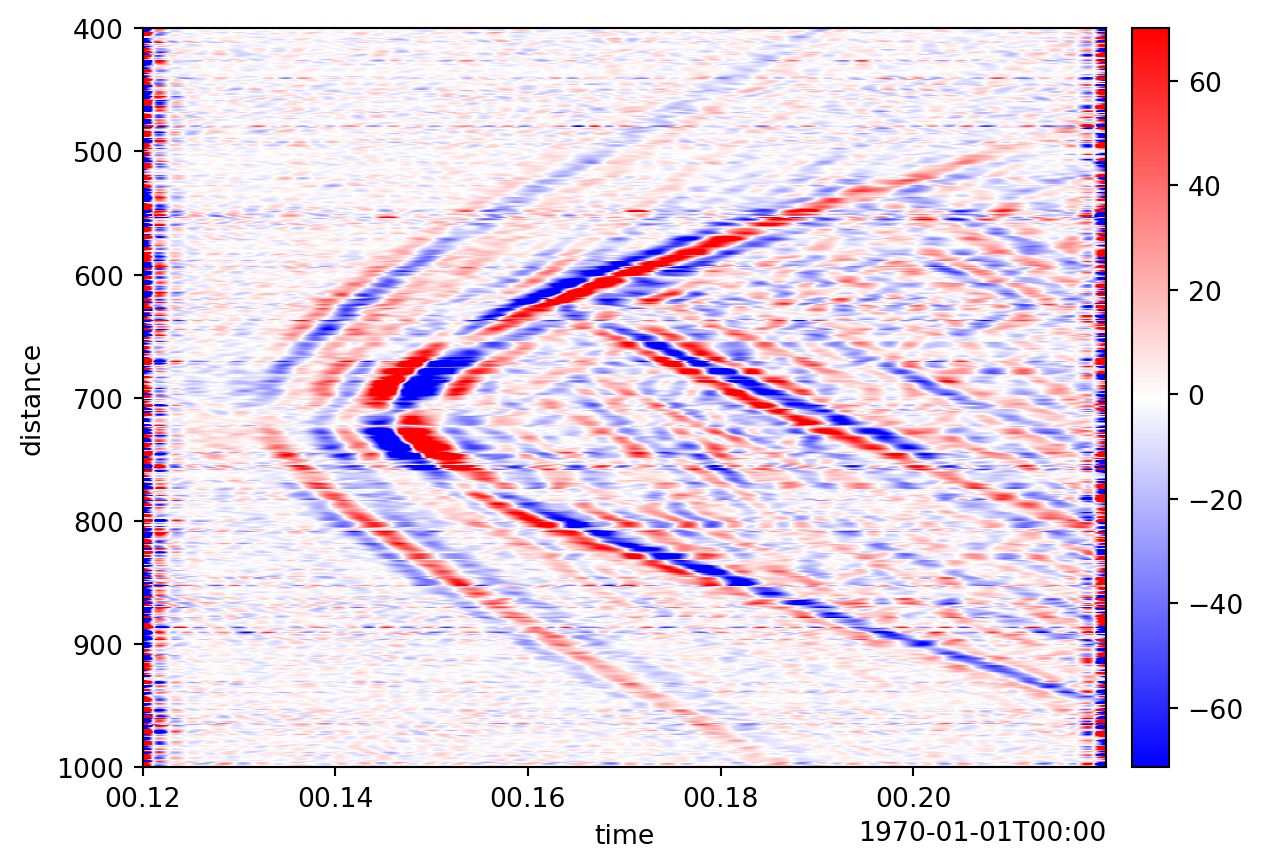
One of the main applications of tapering is to mitigate edge artefacts, or “edge effects” associated with several other types of processing, including filtering. Consider the following:
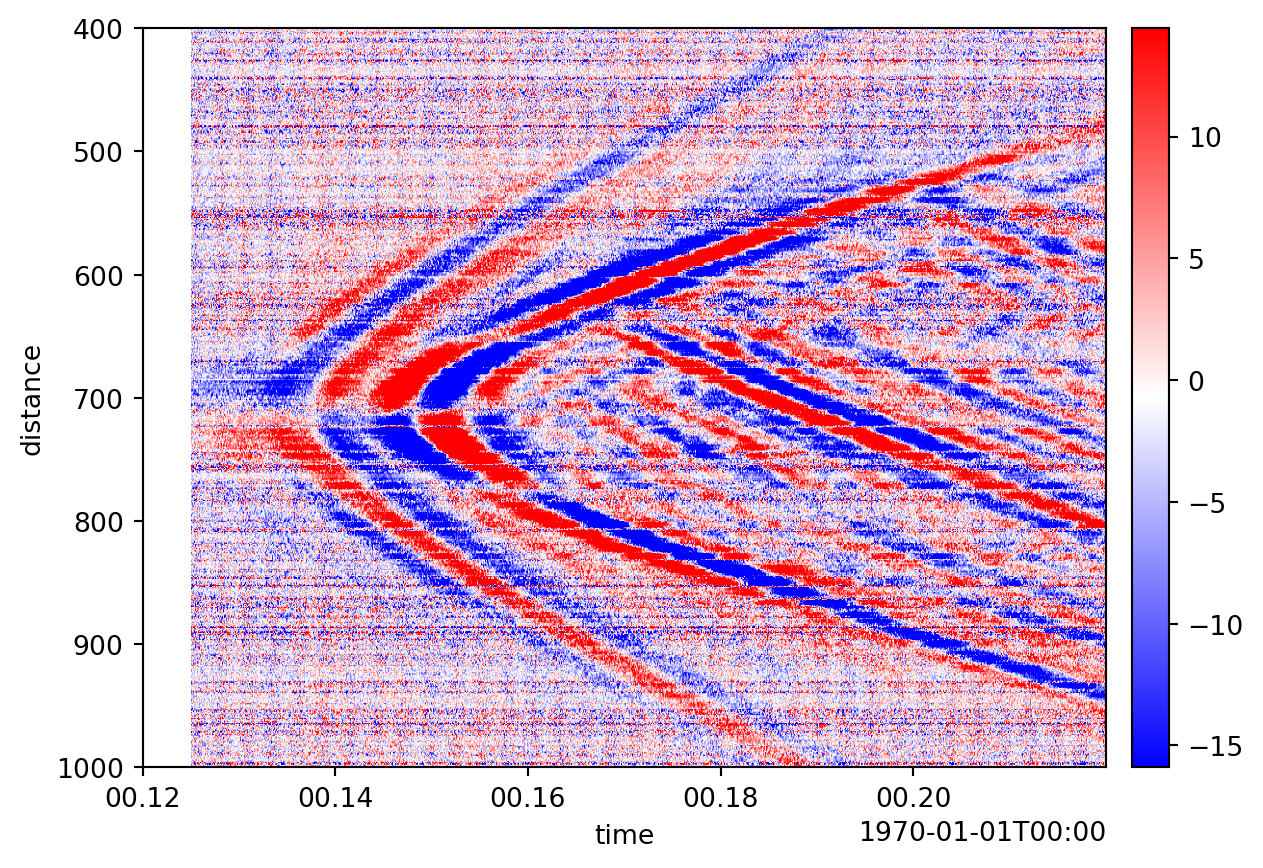
Bandpass filtering without tapering
import dascore as dcpatch = ( dc.get_example_patch('example_event_1') .pass_filter(time=(None, 300)))patch.viz.waterfall(show=True, scale=0.04);
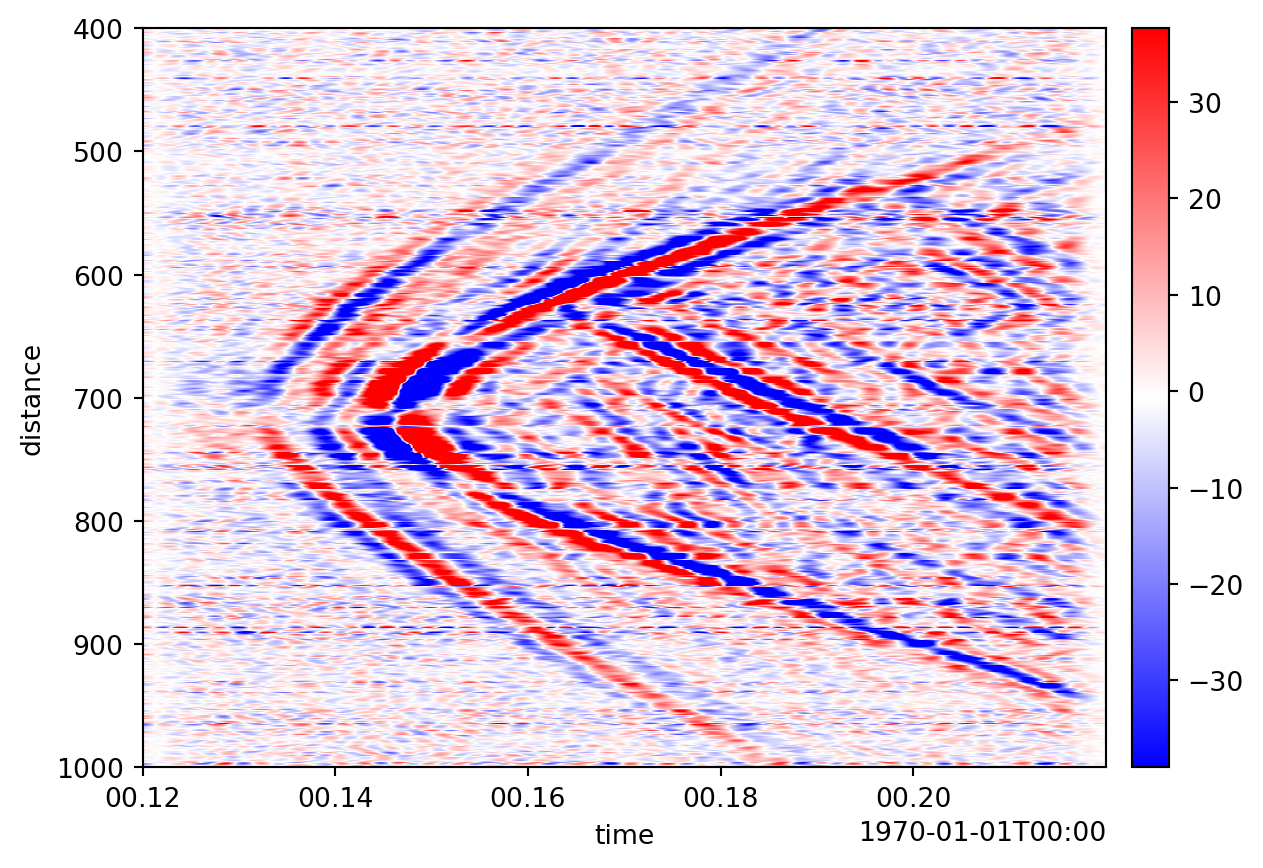
The rolling patch function implements moving window operators similar to pandas rolling. It is useful for smoothing, calculating aggregated statistics, etc.
Here is an example of using a rolling mean to smooth along the time axis for an example event:
import dascore as dcpatch = dc.get_example_patch("example_event_1")# apply moving mean window over every 10 samplesdt = patch.get_coord('time').stepsmoothed = patch.rolling(time=50*dt).mean()smoothed.viz.waterfall(scale=.1);
Notice the NaN values at the start of the time axis. These can be trimmed with Patch.dropna.