import dascore as dc
from dascore import print

pa1 = dc.get_example_patch("random_das")
pa2 = dc.get_example_patch("example_event_1")Patch
A Patch manages data and its associated coordinates and metadata.
Note
The Patch design was inspired by Xarray’s DataArray object
Creating Patches
Patches can be created in a few ways.
Load an Example Patch
DASCore includes several example datasets. They are mostly used for simple demonstrations and testing.
Other supported example patches are:
Code
from pprint import pprint

import dascore as dc

pprint(sorted(dc.examples.EXAMPLE_PATCHES))
['dispersion_event',
'example_event_1',
'example_event_2',
'patch_with_null',
'random_das',
'random_patch_with_lat_lon',
'ricker_moveout',
'sin_wav',
'wacky_dim_coords_patch']Load a File
A single file can be loaded like this:
import dascore as dc
from dascore.utils.downloader import fetch

# first we download an example data file. You can replace
# this with the path to your file.
path = fetch("terra15_das_1_trimmed.hdf5")

# then we get the first patch in the spool
pa = dc.spool(path)[0]
Spools are covered in more detail in the next section.
Manually creating a Patch
Patches can be created from:
- A data array
- Coordinates for labeling each axis
- Attributes (optional)
import numpy as np

import dascore as dc
from dascore.utils.time import to_timedelta64

# Create the patch data
array = np.random.random(size=(300, 2_000))

# Create attributes, or metadata
attrs = dict(
    category="DAS",
    id="test_data1",
    data_units="um/(m * s)"
)

# Create coordinates, labels for each axis in the array.
time_start = dc.to_datetime64("2017-09-18")
time_step = to_timedelta64(1 / 250)
time = time_start + np.arange(array.shape[1]) * time_step

distance_start = 0
distance_step = 1
distance = distance_start + np.arange(array.shape[0]) * distance_step

coords = dict(time=time, distance=distance)

# define dimensions (first label corresponds to data axis 0)
dims = ('distance', 'time')

pa = dc.Patch(data=array, coords=coords, attrs=attrs, dims=dims)
Patch Anatomy
Data
The data is simply an n-dimensional array which is accessed with the data attribute.
import dascore as dc

patch = dc.get_example_patch()

print(f"Data shape is {patch.data.shape}")

print(f"Data contents are\n{patch.data}")
Data shape is (300, 2000)
Data contents are
[[0.77770241 0.23754122 0.82427853 ... 0.36950848 0.07650396 0.23197621]
 [0.49689594 0.44224037 0.70329426 ... 0.12617754 0.11760625 0.78003741]
 [0.20681917 0.19516906 0.17434521 ... 0.84933595 0.36479426 0.80740811]
 ...
 [0.61877586 0.1053084  0.66896335 ... 0.621027   0.43559346 0.49975826]
 [0.75717115 0.25935121 0.09051709 ... 0.36099578 0.9365496  0.10351814]
 [0.15780837 0.29487104 0.58475197 ... 0.22898748 0.23950251 0.49439913]]
Note
The data arrays should be read-only. This means you can’t modify them, but should first make a copy.
import numpy as np

patch.data[:10] = 12  # wont work

array = np.array(patch.data)  # this makes a copy
array[:10] = 12  # then this works
Coords
DASCore implements a special class, called a CoordManager, which managers dimension names, coordinate labels, selecting, sorting, etc. CoordManager has several convenience methods for accessing contained information:
import dascore as dc

patch = dc.get_example_patch()
coords = patch.coords

# Get an array of time values
time_array = coords.get_array("time")

# Get the maximum distance value
distance_max = coords.max("distance")

# Get the time step (NaN if time isn't evenly sampled)
time_step = coords.step("time")
Coords also have a useful string representation:
print(coords)➤ Coordinates (distance: 300, time: 2000) * distance: CoordRange( min: 0 max: 299 step: 1 shape: (300,) dtype: int64 units: m ) * time: CoordRange( min: 2017-09-18 max: 2017-09-18T00:00:07.996 step: 0.004s shape: (2000,) dtype: datetime64[ns] units: s )
Note
There are two types of entities included in coordinates:
Dimensions (dims): the name and labels associated with a patch dimension, which is an axis of the data array (e.g. time, distance)
Coordinates (coords): the name and labels for non-dimension data which can be associated with a dimension (e.g. coordinates “latitude” and “longitude” are often associated with dimension “distance”)
All dimensions are coordinates but not all coordinates are dimensions.
The rest of the CoordManager features are mostly used internally by DASCore, but you can read more about them in the Coordinate Tutorial.
Attrs
The metadata stored in Patch.attrs is a pydantic model which enforces a schema. PatchAttrs.get_summary_df generates a table of the attribute descriptions:
Code
import dascore as dc

dc.PatchAttrs.get_summary_df()| description | |
|---|---|
| attribute | |
| data_type | Describes the quantity being measured. |
| data_category | Describes the type of data. |
| data_units | The units of the data measurements |
| instrument_id | A unique id for the instrument which generated... |
| acquisition_id | A unique identifier linking this data to an ex... |
| tag | A custom string field. |
| station | A station code. |
| network | A network code. |
| history | A list of processing performed on the patch. |
| dims | A tuple of comma-separated dimensions names. |
Specific data formats may also add attributes (e.g. “gauge_length”), but this depends on the parser.
String Representation
DASCore Patches have as useful string representation:
import dascore as dc

patch = dc.get_example_patch()
print(patch)DASCore Patch ⚡ --------------- ➤ Coordinates (distance: 300, time: 2000) * distance: CoordRange( min: 0 max: 299 step: 1 shape: (300,) dtype: int64 units: m ) * time: CoordRange( min: 2017-09-18 max: 2017-09-18T00:00:07.996 step: 0.004s shape: (2000,) dtype: datetime64[ns] units: s ) ➤ Data (float64) [[0.778 0.238 0.824 ... 0.37 0.077 0.232] [0.497 0.442 0.703 ... 0.126 0.118 0.78 ] [0.207 0.195 0.174 ... 0.849 0.365 0.807] ... [0.619 0.105 0.669 ... 0.621 0.436 0.5 ] [0.757 0.259 0.091 ... 0.361 0.937 0.104] [0.158 0.295 0.585 ... 0.229 0.24 0.494]] ➤ Attributes tag: random category: DAS
Selecting (trimming)
Patches are trimmed using the select method. Most commonly, select takes the coordinate name and a tuple of (lower_limit, upper_limit) as the values. Either limit can be None or preferably ... indicating an open interval.
import numpy as np

import dascore as dc

patch = dc.get_example_patch()
attrs = patch.attrs

# select 1 sec after current start time to 1 sec before end time.
one_sec = dc.to_timedelta64(1)
select_tuple = (attrs.time_min + one_sec, attrs.time_max - one_sec)
new = patch.select(time=select_tuple)

# select only the first half of the distance channels.
distance_max = np.mean(patch.coords.get_array('distance'))
new = patch.select(distance=(..., distance_max))
The “relative” keyword is used to trim coordinates based on start (positive) to end (negative)
import dascore as dc
from dascore.units import ft

patch = dc.get_example_patch()

# We can make the example above simpler with relative selection
new = patch.select(time=(1, -1), relative=True)

# select 2 seconds from end to 1 second from end
new = patch.select(time=(-2, -1), relative=True)

# select last 100 ft of distance channels
new = patch.select(distance=(..., -100 * ft), relative=True)
The samples keyword tells select the meaning of the query is in samples rather than the units of the selected dimension. Unlike absolute selections, these are always relative to the data contained in the patch (eg 0 refers to the first sample along the dimension).
import dascore as dc

patch = dc.get_example_patch()

# trim patch to only include first 10 time rows (or columns)
new = patch.select(time=(..., 10), samples=True)

# Only include the last distance column or row
new = patch.select(distance=-1, samples=True)
Processing
The patch has several methods which are intended to be chained together via a fluent interface, meaning each method returns a new Patch instance.
import dascore as dc
pa = dc.get_example_patch()

out = (
    pa.decimate(time=8)  # decimate to reduce data volume by 8 along time dimension
    .detrend(dim='distance')  # detrend along distance dimension
    .pass_filter(time=(..., 10))  # apply a low-pass 10 Hz butterworth filter
)
The processing methods are located in the dascore.proc module. The patch processing tutorial provides more information about processing routines.
Visualization
DASCore provides some visualization functions in the dascore.viz module or using the Patch.viz namespace. DASCore generally only implements simple, matplotlib based visualizations but other DASDAE packages will likely do more interesting visualizations.
import dascore as dc

patch = (
    dc.get_example_patch('example_event_1')
    .taper(time=0.05)
    .pass_filter(time=(None, 300))
)

patch.viz.waterfall(show=True, scale=0.2);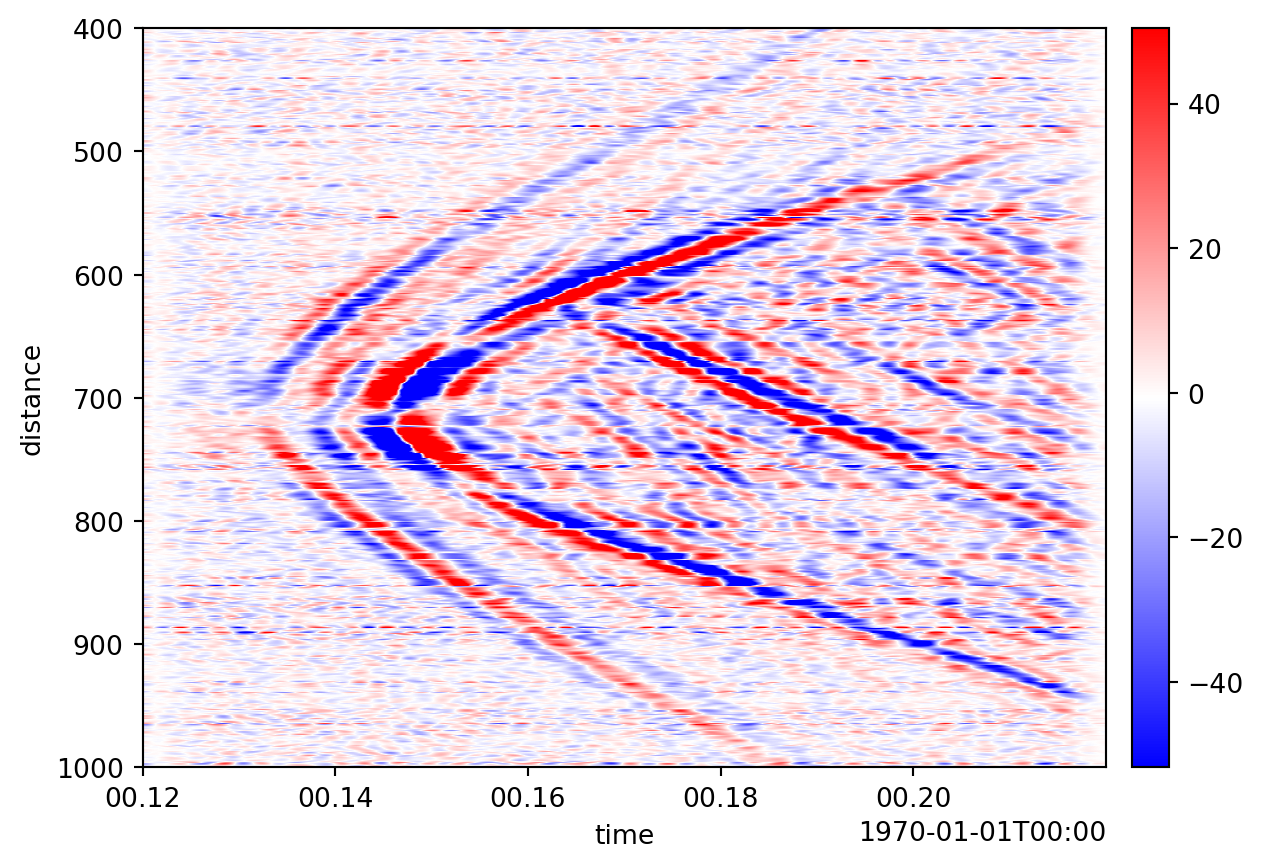
Modifying Patches
Because patches should be treated as immutable objects, they can’t be modified with normal item assignment. There are a few methods that return new patches with modifications, however, that are functionally the same.
New
Often you may wish to modify one aspect of the patch. Patch.new is designed for this purpose:
import dascore as dc
pa = dc.get_example_patch()

# create a copy of patch with new data but coords and attrs stay the same
new = pa.new(data=pa.data * 10)
Update Attrs
Patch.update_attrs is for making small changes to the patch attrs (metadata) while keeping the unaffected metadata (Patch.new would require you replace the entirety of attrs).
import dascore as dc
pa = dc.get_example_patch()

# update existing attribute 'network' and create new attr 'new_attr'
pa1 = pa.update_attrs(network='exp1', new_attr=42)
Update Coords
Patch.update_coords returns a new patch with the coordinates changed in some way. These changes can include: - Modifying (updating) existing coordinates - Adding new coordinates - Changing coordinate dimensional association
Modifying coordinates
Coordinates can be updated by specifying a new array which should take the place of the old one:
import dascore as dc

pa = dc.get_example_patch()

# one 1 second to all values in the time array.
one_second = dc.to_timedelta64(1)
old_time = pa.coords.get_array('time')
new = pa.update_coords(time=old_time + one_second)
Or by specifying new min, max, or step values for a coordinate.
import dascore as dc

pa = dc.get_example_patch()

# change the starting time of the array
new_time = pa.coords.min('time') + one_second
new = pa.update_coords(time_min=new_time)
Adding coordinates
It is common to have additional coordinates, such as latitude/longitude attached to a particular dimension (often distance). It is also possible to add coordinates that are not associated with any dimensions.
import numpy as np

import dascore as dc

pa = dc.get_example_patch()
coords = pa.coords
dist = coords.get_array('distance')
time = coords.get_array('time')

# Add a single coordinate associated with distance dimension
lat = np.arange(0, len(dist)) * .001 -109.857952
# note the tuple form: (associated_dimension, value)
out_1 = pa.update_coords(latitude=('distance', lat))

# Add multiple coordinates associated with distance dimension
lon = np.arange(0, len(dist)) *.001 + 41.544654
out_2 = pa.update_coords(
    latitude=('distance', lat),
    longitude=('distance', lon),
)

# Add coordinate associted with multiple dimensions
quality = np.ones_like(pa.data)
out_3 = pa.update_coords(
    quality=(pa.dims, quality)
)

# add coordinate associated with no dimension
no_dim_coord = pa.update_coords(non_dim=(None, np.arange(10)))
Changing coordinate dimensional association
The dimensions each coordinate is associated with can be changed. For example, to remove a coordinate’s dimension association:
import dascore as dc

# this patch has latitude and longitude coordinates
patch = dc.get_example_patch("random_patch_with_lat_lon")

# dissassociate latitude from distance
lat = patch.coords.get_array('latitude')
patch_detached_lat = patch.update_coords(latitude=(None, lat))
Dropping Coordinates
Non-dimensional coordinates can be dropped using Patch.drop_coords. Dimensional coordinates, however, cannot be dropped doing so would force the patch data to become degenerate.
import dascore as dc

# this patch has latitude and longitude coordinates
patch = dc.get_example_patch("random_patch_with_lat_lon")

# drop latitude, this wont affect the data or other coordinates
patch_dropped_lat = patch.drop_coords("latitude")
print(patch_dropped_lat.coords)
➤ Coordinates (distance: 300, time: 2000) * distance: CoordRange( min: 0.0 max: 2.99e+02 step: 1.0 shape: (300,) dtype: float64 ) * time: CoordRange( min: 2017-09-18 max: 2017-09-18T00:00:07.996 step: 0.004s shape: (2000,) dtype: datetime64[ns] units: s ) longitude ('distance',): CoordRange( min: 41.5 max: 41.8 step: 0.001 shape: (300,) dtype: float64 )
Coords in Patch Initialization
Any number of coordinates can also be assigned when the patch is initiated. For coordinates other than those of the patch dimensions, the associated dimensions must be specified. For example:
import dascore as dc
import numpy as np

# create data for patch
rand = np.random.RandomState(13)
array = rand.random(size=(20, 100))
time1 = np.datetime64("2020-01-01")

# create patch attrs
attrs = dict(dx=1, d_time=1 / 250.0, category="DAS", id="test_data1")
time_deltas = dc.to_timedelta64(np.arange(array.shape[1]) * attrs["d_time"])

# create coordinate data
distance = np.arange(array.shape[0]) * attrs["dx"]
time = time1 + time_deltas
quality = np.ones_like(array)
latitude = np.arange(array.shape[0]) * .001 - 111.00

# create coord dict
coords = dict(
    distance=distance,
    time=time,
    latitude=("distance", latitude),  # Note distance is attached dimension
    quality=(("distance", "time"), quality),  # Two attached dimensions here
)

# Define dimensions of array and init Patch
dims = ("distance", "time")
out = dc.Patch(data=array, coords=coords, attrs=attrs, dims=dims)
Method Chaining
In most cases, you should use method chaining as part of a fluent interface when working with patches.
For example:
import dascore as dc

pa = (
    dc.get_example_patch()  # load the patch
    .pass_filter(time=(1, 10))  # apply bandpass filter
    .detrend(dim='time')  # detrend along time dimension
)
Similar to Pandas, Patch has a pipe method so non-patch methods can still be used in a method chain.
import dascore as dc

def func(patch, arg1=1):
    """Example non-patch method"""
    return patch.update_attrs(arg1=1)

pa = (
    dc.get_example_patch()
    .pass_filter(time=(..., 10))
    .detrend('time', 'linear')
    .pipe(func, arg1=3)
)
Units
As mentioned in the units section of the concept page, DASCore provides first-class support for units. Here are a few examples:
Patch units
There are two methods for configuring the units associated with a Patch.
Patch.set_units sets the units on a patch or its coordinates. Old units are simply overwritten without performing any conversions. The first argument sets the data units and the keywords set the coordinate units.
Patch.convert_units converts the existing units of data or coordinates by appropriately transforming the data or coordinates arrays. If no units exist they will be set.
import dascore as dc

patch = dc.get_example_patch()

# Set data units and distance units; don't do any conversions
patch_set_units = patch.set_units("m/s", distance="ft")

# Convert data units and distance units; will modify data/coords
# to correctly do the conversion.
patch_conv_units = patch_set_units.convert_units("ft/s", distance='m')
The data or coordinate units attributes are Pint Quantity, but they can be converted to strings with get_quantity_str.
import dascore as dc
from dascore.units import get_quantity_str

patch = dc.get_example_patch().set_units("m/s")

print(type(patch.attrs.data_units))
print(get_quantity_str(patch.attrs.data_units))<class 'pint.Quantity'>
m / s
Units in processing functions
import dascore as dc
from dascore.units import m, ft

pa = dc.get_example_patch()

# sub-select a patch to only include distance from 10ft to 10m.
sub_selected = pa.select(distance=(10*ft, 10*m))

# filter patch for spatial wavelengths from 10m to 100m
dist_filtered = pa.pass_filter(distance=(10*m, 100*m))
See the documentation on Patch.select and Patch.pass_filter for more details.
Patch Operations
Patches implement common operators which means that many ufunc type operations can be applied directly on a patch with built-in python operators.
In the case of scalars and numpy arrays, the operations are broadcast over the patch data. In the case of two patches, compatibility between patches are first checked, the intersection of the coords and attrs are calculated, then the operator is applied to both patchs’ data. Here are a few examples:
Patch operations with scalars
import numpy as np

import dascore as dc

patch = dc.get_example_patch()

out1 = patch / 10
assert np.allclose(patch.data / 10, out1.data)

out2 = patch ** 2.3
assert np.allclose(patch.data ** 2.3, out2.data)

out3 = patch - 3
assert np.allclose(patch.data - 3, out3.data)
Units are also fully supported.
import dascore as dc
from dascore.units import m, s

patch = dc.get_example_patch().set_units("m/s")

# multiplying patches by a quantity with units updates the data_units attribute.
new = patch * 10 * m/s

print(f"units before operation {patch.attrs.data_units}")
print(f"units after operation {new.attrs.data_units}")
units before operation 1.0 m / s
units after operation 1.0 m ** 2 / s ** 2
Patch operations with numpy arrays
import numpy as np

import dascore as dc

patch = dc.get_example_patch()
ones = np.ones(patch.shape)

out1 = patch + ones
assert np.allclose(patch.data + ones, out1.data)
Units also work with numpy arrays.
import numpy as np

import dascore as dc
from dascore.units import furlongs

patch = dc.get_example_patch()
ones = np.ones(patch.shape) * furlongs

out1 = patch * ones
print(f"units before operation {patch.attrs.data_units}")
print(f"units after operation {out1.attrs.data_units}")
units before operation None
units after operation 1 fur
Patch operations with other patches
import numpy as np

import dascore as dc
from dascore.units import furlongs

patch = dc.get_example_patch()

# adding two patches together simply adds their data their
# and checks/merges coords and attrs.
out = patch + patch

assert np.allclose(patch.data * 2, out.data)
See merge_compatible_coords_attrs for more details on how attributes and coordinates are handled when performing operations on two patches.