Sometimes we have spatial coordinates in a table which are associated with a patch dimension. For example, the results of a tap-test may associate X, Y, and Z values to the dimensions “distance”. DASCore provides the patch function coords_from_df for just this purpose. The functionality is not limited to spatial coordinates; it can be used to add any coordinates to any existing dimension.
Here, we - make a patch and coordinates from example data - Call a command that adds the coordinates - Plot coordinates for comparison
Code
import pandas as pdimport dascore as dcfrom dascore.utils.downloader import fetch# get path for example coordinatespath = fetch("brady_hs_DAS_DTS_coords.csv")# read coordinates data from csv filecoord_table = pd.read_csv(path).rename(columns={"Channel": "distance"})# Make patch from examplepatch = dc.get_example_patch()# get length of distance axisdist_len = patch.coord_shapes["distance"][0]# make a dictionary of unitsunits = {a:"m"for a in coord_table.columns[1:]}# select portion of new coordinates to map to existing coordinatenew_coordinates = coord_table.iloc[51:]
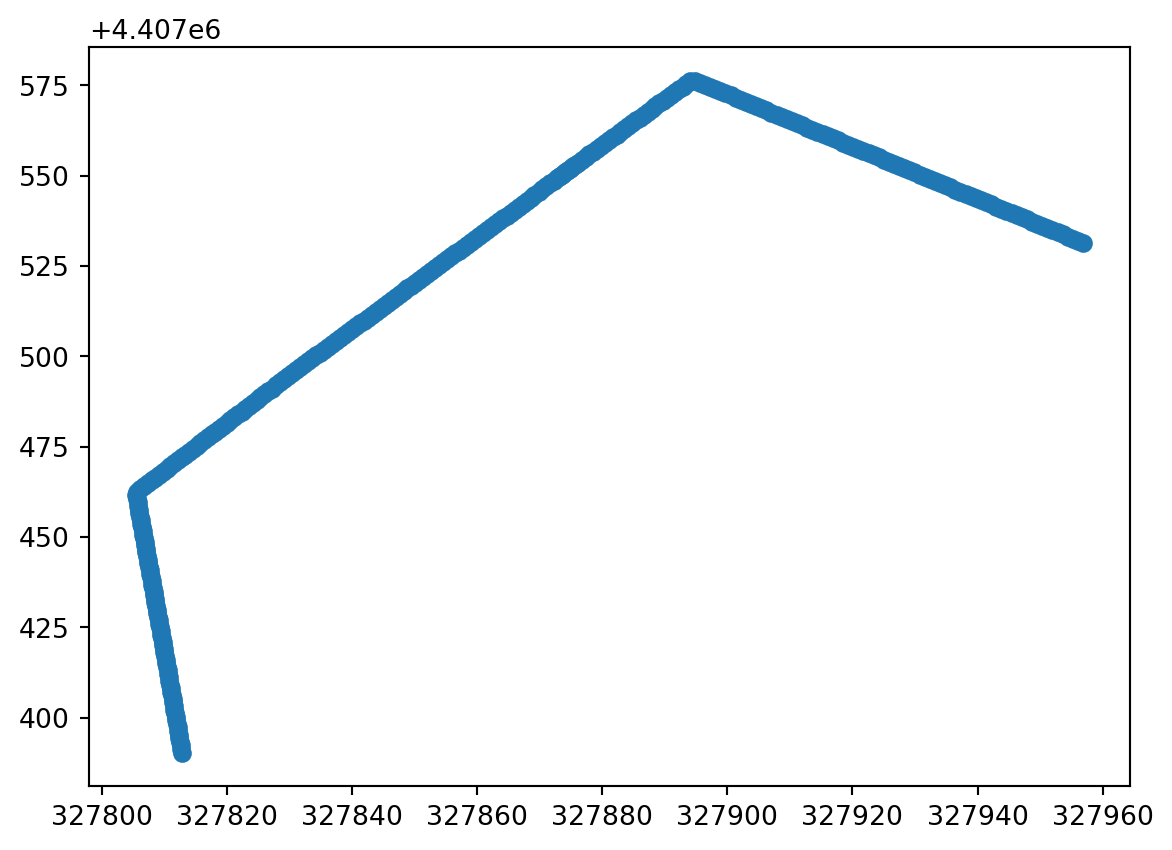
import matplotlib.pyplot as pltimport dascore as dcpatch = dc.get_example_patch()# add coordinates to patchpatch_with_coords = patch.coords_from_df( new_coordinates, units=units,extrapolate=True,)# plot coordinatescoords = patch_with_coords.coordsX = coords.get_array('X')Y = coords.get_array('Y')plt.scatter(X,Y);